Parallel Execution Engines: How to Scale Virtual Machine Performance Beyond Single-Core

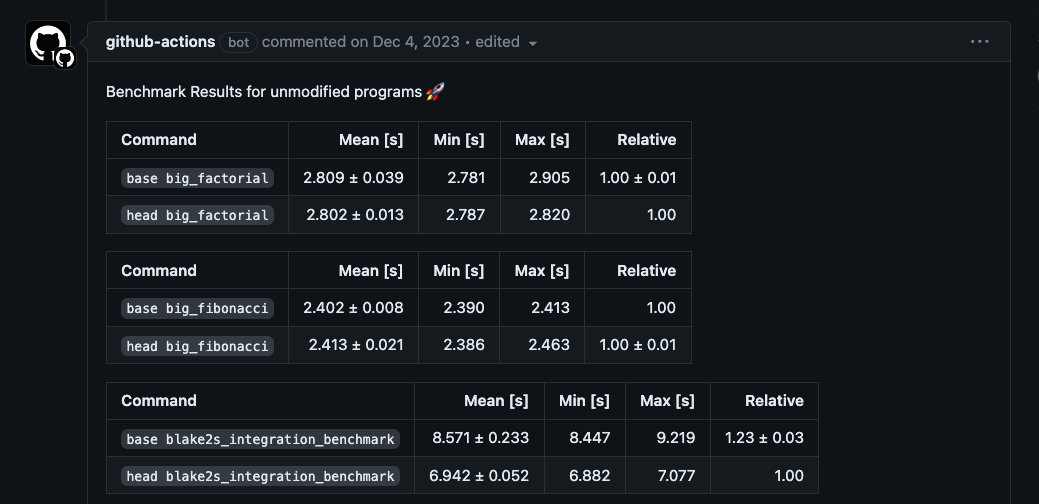
At LambdaClass, benchmarks and performance analysis are critical aspects of our development process. We always perform performance analysis in every PR via our CI pipelines to spot any performance issues.
The Cairo virtual machine is not an exception since it is a core part of the Starknet network. In this post, we will delve into how we investigated a performance regression and then optimized a core data structure in the library to improve its multicore performance.
A first look
Some background: Not long ago, we introduced an optional feature, lambdaworks-felt, which marked a significant improvement in our performance metrics. It uses the Felt (field element) implementation from our cryptography library, LambdaWorks, which replaced a more naive implementation using BigInt.
Last week, the Pathfinder team from Equilibrium (as always, we want to thank them for finding and raising this issue) observed an unexpected scaling behavior when they tried to re-execute some Sepolia testnet blocks using their re_execute tool that spins up several CairoVMs to run the block’s transactions in parallel.
When several instances of the CairoVM with the lambda works-felt feature enabled are executed on a hyperthreading-enabled processor, execution time does not scale with the number of enabled threads as well as without the lambda works-felt feature.
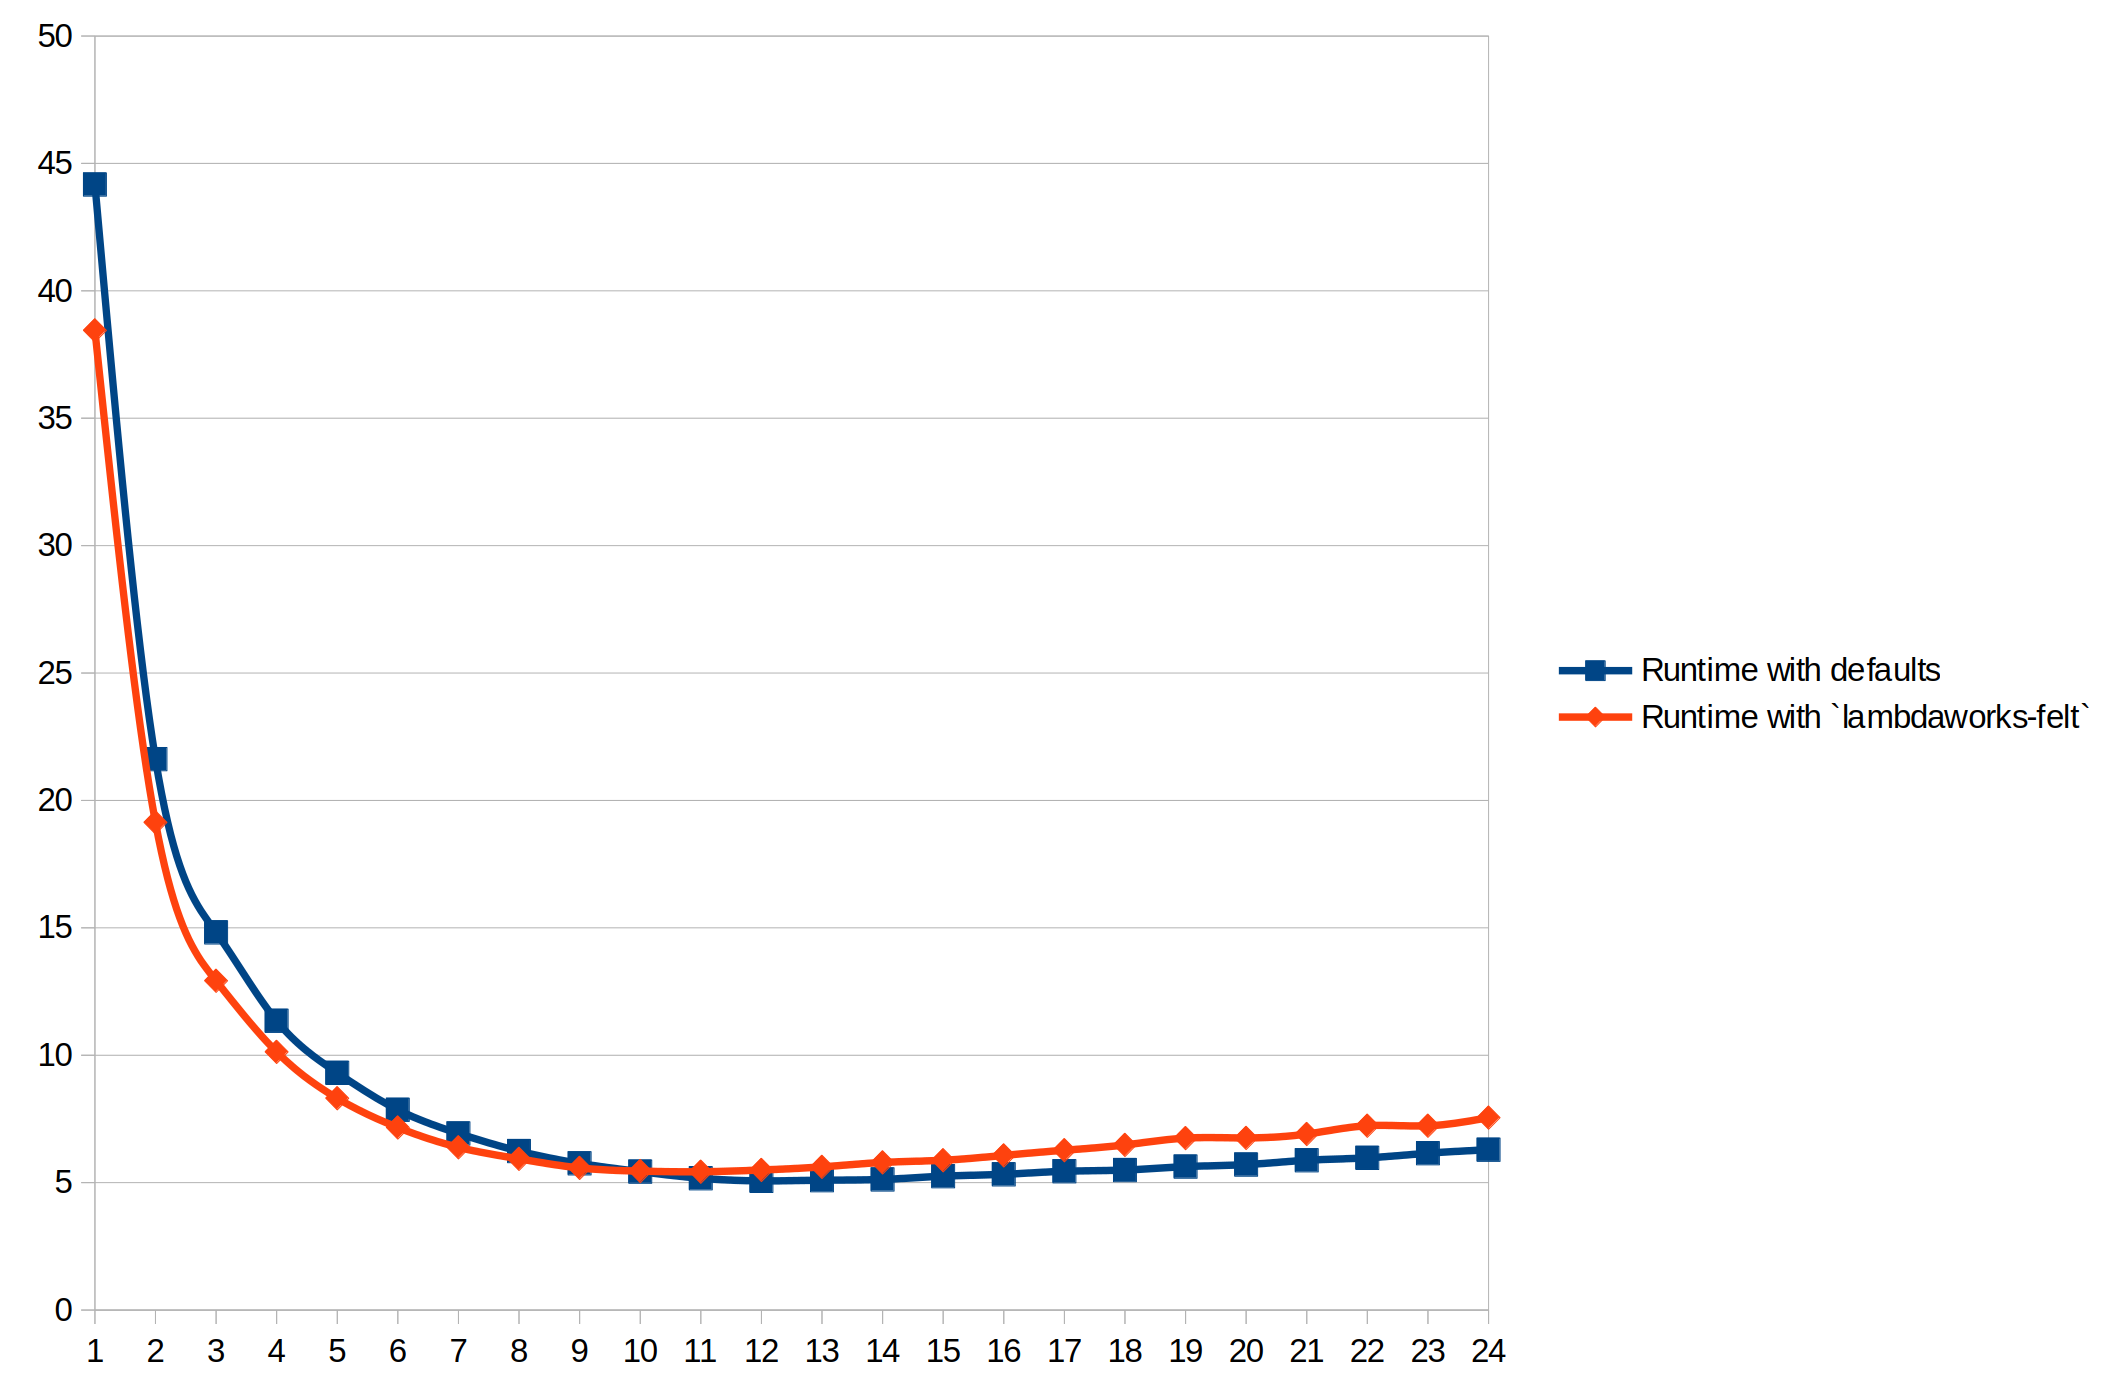
The figure, contributed by the Pathfinder team, shows the results of a benchmark performed on a Ryzen 5900X. As you can see, the CairoVM with the lambdaworks-felt feature performs better when you execute it with fewer threads. Still, the run with defaults implementation (Felt type implemented using the num_bigint crate) scales better as the number of threads increases.
Digging deeper
Our first task was to reproduce what had been reported. Once we saw the same results as the Pathfinder team, we could start investigating possible causes. After that, we started investigating this behavior and found that we had many cache misses when using the lambdaworks-based felt.
VM with Bigint felt:
$ perf stat -e cache-misses ./binaries/re_execute_main sepolia-testnet_0.11.0_47191.sqlite 47000 47191

 Performance counter stats for './binaries/re_execute_main sepolia-testnet_0.11.0_47191.sqlite 47000 47191':

        2094269051      cache-misses

       5.926431912 seconds time elapsed

     168.877378000 seconds user
       3.675086000 seconds sys
VM with Lambdaworks felt:
$ perf stat -e cache-misses ./binaries/re_execute_main_lambdaworks sepolia-testnet_0.11.0_47191.sqlite 47000 47191

 Performance counter stats for './binaries/re_execute_main_lambdaworks sepolia-testnet_0.11.0_47191.sqlite 47000 47191':

        2426557083      cache-misses

       6.931543878 seconds time elapsed

     197.086250000 seconds user
       6.588698000 seconds sys
So, here we can see that the lambdaworks felt has 16% more cache misses than the BigInt implementation.
How does this inform our search for a cause? We talked to the team member who originally benchmarked the CairoVM and its relation to memory allocation when running and integrated lambdaworks-felt into the CairoVM. When we showed him these results, he mentioned that looking at the felt layout in memory when the VM is running would be a good idea.
When the CairoVM runs a program, it stores the felt values in its memory representation, which encodes the rules and guarantees necessary for proving. So for a running program, memory is a collection of MemoryCells, which in turn wraps a boolean that signals if the memory cell was accessed during the program execution and a MaybeRelocatable value, an enum that can be either a felt or a Relocatable value:
pub(crate) struct MemoryCell(MaybeRelocatable, bool);
pub enum MaybeRelocatable {
    RelocatableValue(Relocatable),
    Int(Felt252),
}
When looking at cache issues, one usually looks at the shape or layout that values take when in memory. We noticed that when using the lambdaworks-felt feature, the MemoryCell structure size increased from 40 to 48 bytes, which was the root cause of the increase in cache misses when running parallel workloads.
We can guess that since multiple VMs are trying to populate the cache with their values, felts running over a line would cause more cache thrashing.
Another factor to take into account is the use of SMT (Simultaneous multithreading,** also known as Hyper-Threading) in AMD and Intel CPUs. This technique basically runs two logical cores inside a single physical core, which usually improves overall performance.
But that’s not always the case; sometimes, it gets in the way. For example, one logical core can evict cached items that later the other logical core will need, leading to more cache misses.
Just guessing is magical thinking, which is for astrologists, so we decided to implement a change and measure the impact.
To address this, we refactored that structure to a more cache-friendly representation. The new optimized MemoryCell can now fit in half a 64-byte cache line instead of almost a full cache line. The new structure now stores the data and metadata in a raw form using the spare bits in the felt representation, and the MaybeRelocatable instances are built as needed from it.
/// [`MemoryCell`] represents an optimized storage layout for the VM memory.
/// It's specified to have both size an alignment of 32 bytes to optimize cache access.
/// Typical cache sizes are 64 bytes; a few cases might be 128 bytes, meaning 32 bytes aligned to
/// 32 bytes boundaries will never get split into two separate lines, avoiding double stalls and
/// reducing false sharing and evictions.
/// The trade-off is extra computation for conversion to our "in-flight" `MaybeRelocatable` and
/// `Felt252` as well as some extra copies. Empirically, this seems to be offset by the improved
/// locality of the bigger structure for Lambdaworks. There is a big hit from the conversions when
/// using the `BigUint` implementation, since those force allocations on the heap, but since that's
/// dropped in later versions anyway it's not a priority. For Lambdaworks, the new copies are mostly
/// to the stack, which is typically already in the cache.
/// The layout uses the 4 MSB in the first `u64` as flags:
/// - BIT63: NONE flag, 1 when the cell is actually empty.
/// - BIT62: ACCESS flag, 1 when the cell has been accessed in a way observable to Cairo.
/// - BIT61: RELOCATABLE flag, 1 when the contained value is a `Relocatable`, 0 when it is a
/// `Felt252`.
/// `Felt252` values are stored in big-endian order to keep the flag bits free.
/// `Relocatable` values are stored as native endian, with the 3rd word storing the segment index
/// and the 4th word storing the offset.
#[repr(align(32))]
pub(crate) struct MemoryCell([u64; 4]);
After this change, when we re-execute some old Sepolia testnet blocks, we can see that the new cache-friendly MemoryCell scales better when using hyper threading. Outperforming both the old MemoryCell with a BigUint -backed Felt and our previous implementation of the MemoryCell with the Lambdaworks felt.
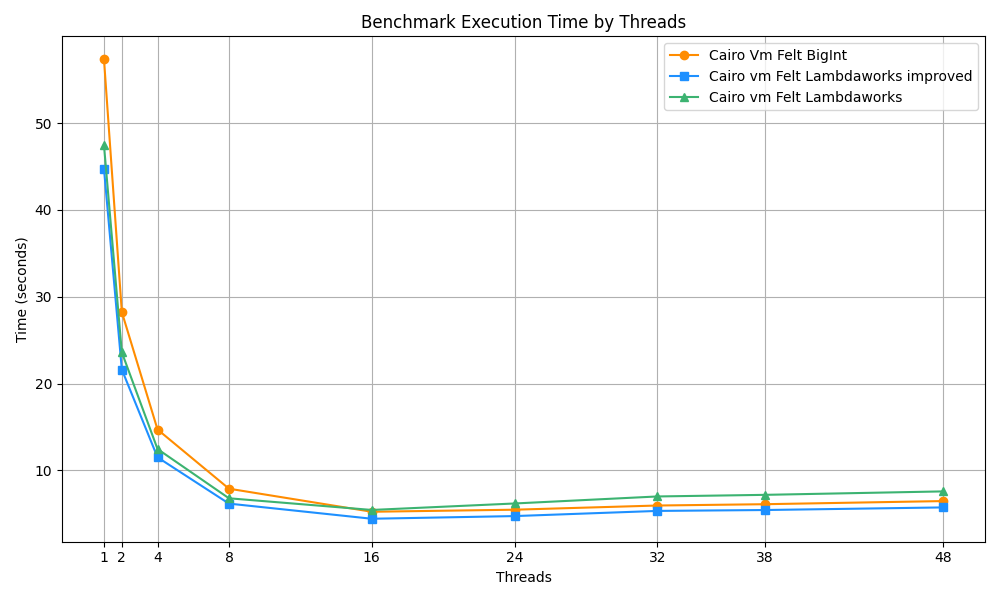
Benchmarks run on AMD Ryzen 9 5950X 16-Core Processor, Architecture:x86, CPU(s): 32
That figure was generated with the data extracted by running hyperfine, a CLI-based benchmarking tool, with different number of threads so we can get how each change performed as we increase the number of threads.
Running benchmark for 1 threads
Benchmark 1: re_execute_main threads: 1
  Time (abs ≡):        57.351 s               [User: 55.107 s, System: 2.174 s]

Benchmark 2: re_execute_fixed_felt threads: 1
  Time (abs ≡):        44.760 s               [User: 42.510 s, System: 2.197 s]

Benchmark 3: re_execute_main_lambdaworks threads: 1
  Time (abs ≡):        47.458 s               [User: 45.454 s, System: 1.948 s]

Summary
  re_execute_fixed_felt threads: 1 ran
    1.06 times faster than re_execute_main_lambdaworks threads: 1
    1.28 times faster than re_execute_main threads: 1
Running benchmark for 2 threads
Benchmark 1: re_execute_main threads: 2
  Time (abs ≡):        28.247 s               [User: 54.708 s, System: 1.647 s]

Benchmark 2: re_execute_fixed_felt threads: 2
  Time (abs ≡):        21.625 s               [User: 41.931 s, System: 1.231 s]

Benchmark 3: re_execute_main_lambdaworks threads: 2
  Time (abs ≡):        23.607 s               [User: 45.111 s, System: 1.987 s]

Summary
  re_execute_fixed_felt threads: 2 ran
    1.09 times faster than re_execute_main_lambdaworks threads: 2
    1.31 times faster than re_execute_main threads: 2
Running benchmark for 4 threads
Benchmark 1: re_execute_main threads: 4
  Time (abs ≡):        14.718 s               [User: 56.848 s, System: 1.445 s]

Benchmark 2: re_execute_fixed_felt threads: 4
  Time (abs ≡):        11.516 s               [User: 44.374 s, System: 1.264 s]

Benchmark 3: re_execute_main_lambdaworks threads: 4
  Time (abs ≡):        12.472 s               [User: 47.662 s, System: 1.627 s]

Summary
  re_execute_fixed_felt threads: 4 ran
    1.08 times faster than re_execute_main_lambdaworks threads: 4
    1.28 times faster than re_execute_main threads: 4
Running benchmark for 8 threads
Benchmark 1: re_execute_main threads: 8
  Time (abs ≡):         7.904 s               [User: 61.202 s, System: 0.705 s]

Benchmark 2: re_execute_fixed_felt threads: 8
  Time (abs ≡):         6.186 s               [User: 47.780 s, System: 0.771 s]

Benchmark 3: re_execute_main_lambdaworks threads: 8
  Time (abs ≡):         6.800 s               [User: 52.407 s, System: 0.947 s]

Summary
  re_execute_fixed_felt threads: 8 ran
    1.10 times faster than re_execute_main_lambdaworks threads: 8
    1.28 times faster than re_execute_main threads: 8
Running benchmark for 16 threads
Benchmark 1: re_execute_main threads: 16
  Time (abs ≡):         5.248 s               [User: 77.844 s, System: 1.159 s]

Benchmark 2: re_execute_fixed_felt threads: 16
  Time (abs ≡):         4.443 s               [User: 65.118 s, System: 1.575 s]

Benchmark 3: re_execute_main_lambdaworks threads: 16
  Time (abs ≡):         5.456 s               [User: 80.535 s, System: 1.852 s]

Summary
  re_execute_fixed_felt threads: 16 ran
    1.18 times faster than re_execute_main threads: 16
    1.23 times faster than re_execute_main_lambdaworks threads: 16

Running benchmark for 32 threads
Benchmark 1: re_execute_main threads: 32
  Time (abs ≡):         5.967 s               [User: 168.953 s, System: 3.411 s]

Benchmark 2: re_execute_fixed_felt threads: 32
  Time (abs ≡):         5.345 s               [User: 149.728 s, System: 4.033 s]

Benchmark 3: re_execute_main_lambdaworks threads: 32
  Time (abs ≡):         7.010 s               [User: 199.011 s, System: 5.984 s]

Summary
  re_execute_fixed_felt threads: 32 ran
    1.12 times faster than re_execute_main threads: 32
    1.31 times faster than re_execute_main_lambdaworks threads: 32

    1.32 times faster than re_execute_main_lambdaworks threads: 48
We also ran perf stat to check the cache misses using this new version, and it is indeed more cache efficient, reducing the cache misses by %21 concerning the old MemoryCell implementation with Lambdaworks and 9% less cache misses than the one with Bigints.
$ perf stat -e cache-misses ./binaries/re_execute_fixed_felt sepolia-testnet_0.11.0_47191.sqlite 47000 47191

 Performance counter stats for './binaries/re_execute_fixed_felt sepolia-testnet_0.11.0_47191.sqlite 47000 47191':

        1906296012      cache-misses

       5.278474869 seconds time elapsed

     148.647511000 seconds user
       4.168127000 seconds sys
ARM Architecture Considerations
While we have seen a performance regression related to cache misses in multi-threaded environments for x86_64 architectures, it's important to note that this issue is not prevalent in systems utilizing ARM CPUs. Our benchmarks, conducted on a MacBook M3 Pro equipped with 18 GB of RAM and 11 cores, showcase a different performance profile.
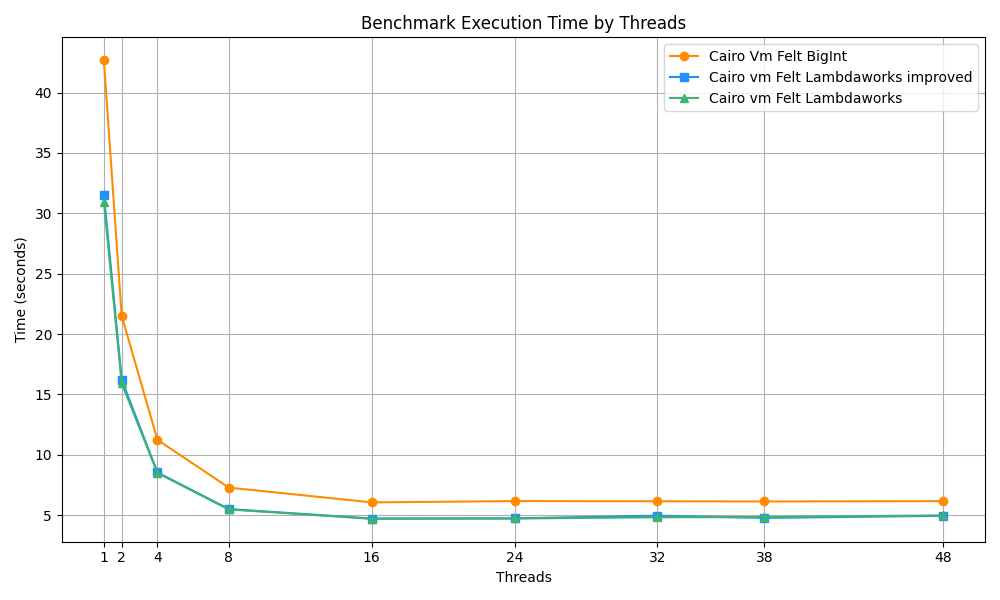
In the image, you can notice that:
- In an SMT context, the ARM-based system displays superior scalability when using the lambdaworks-based MemoryCell struct instead of the BigInt implementation.
- The MemoryCell modifications don't impact the execution performance on ARM systems.
This distinction in performance between ARM and more traditional x86_64 processors (such as those from Intel or AMD) can be attributed to architectural differences in cache management and bigger cache line sizes (128 bytes in the Apple Silicon processors). ARM processors are designed with a unique approach to cache utilization, wherein individual cores possess dedicated cache resources. This design choice prevents the scenario of cache contention where two cores compete for the same cache lines, a situation that can lead to increased cache misses.
Conclusion
So all is well and nice, but two questions remain: Why didn’t we see this before, and how do we ensure we see it in the future? How can we improve our engineering processes by considering what we learned?
Our benchmarks modeled a workload without the necessary concurrency to surface the issue.
To ensure a performance regression test, we need to write some code that will trigger it in the right circumstances, a minimal version of re_execute that will allow us to vary parameters to cover a broader area of the problem space (number of VMs running in parallel, number of threads, number of processors used, processor architecture, etc.).
Two lessons learned (or rather, reinforced) are:
-
Don’t assume your code will only run under specific workloads. Try to model the real world as much as possible and measure to make sure.
-
Don’t assume that a change to the code that shows a performance improvement measured “locally” will positively impact the overall performance of the entire program.
This experience highlights that achieving maximum performance in Rust often requires consideration of lower-level details beyond merely using enums. It underscores the importance of understanding and optimizing CPU cache behavior in performance-sensitive applications.
By rethinking our approach to data storage and access and getting a little creative with our structures, we’ve reduced cache misses and significantly improved the scaling of our VMs on multicore systems.
