How We Made an Ethereum Rust Execution Engine 20x Faster: Profiling-Driven Optimization
Over the past months, the ethrex team has been relentlessly focused on performance optimization. Through systematic profiling, targeted improvements, and architectural changes, we've achieved a 20x improvement in block execution throughput.

Over the past months, the ethrex team has been relentlessly focused on performance optimization.
Through systematic profiling, targeted improvements, and architectural changes, we've achieved a 20x improvement in block execution throughput.
Real-world examples of performance work are valuable (for example, we're big fans of Nicholas Nethercote's series on speeding up the rust compiler), so we felt it was worthwhile to go into how this was achieved.
If you query the repository's PRs and filter for the 'performance' label, you'll find over a hundred (!) pull requests, 34 alone since November last year.
If you query for any PR that was either merged or closed, you'll find even more that were discarded, valiant attempts that did not survive their encounter with reality.
It seems you can't stress enough that the foundation these kinds of improvements rest on is empirical, measuring, hypothesizing, and validating with more observation.
Formulating the hypothesis that a certain modification will be an improvement (or validating the ones suggested by an agent) does require being familiar with the contextual knowledge of the codebase.
And as we often repeat, having a simpler code base facilitates this enormously.
In the case of ethrex, to better understand the following we highly recommend going over the project's documentation.
Before going into what exactly enabled such an improvement, let's discuss performance engineering work in general.
What exactly do we want to optimize?
Initially, as the post title suggests, we measured MGas/sec because... well because that is what many others were using to benchmark Ethereum client execution, and if you want to compare you need to compare apples to apples.
There is a relationship between how much gas is spent per compute during contract code execution when processing a transaction, so the more gas per second, the faster you go. However, it is not exactly as direct as measuring time, how long did it take to process a transaction, with all it involves? Using proxy metrics can sometimes lead to situations that feel like eating ramen with cue sticks. And you still don't escape from having to specify as exactly as possible everything in the context: hardware, operating system, load, etc.
Measuring is hard. So you automate it.
Ethrex's benchmarks are run by CI on every change, and reports are regularly posted at benchmarks.ethrex.xyz/.
Comparison with other clients can be found at EthPandas' excellent Lab page:
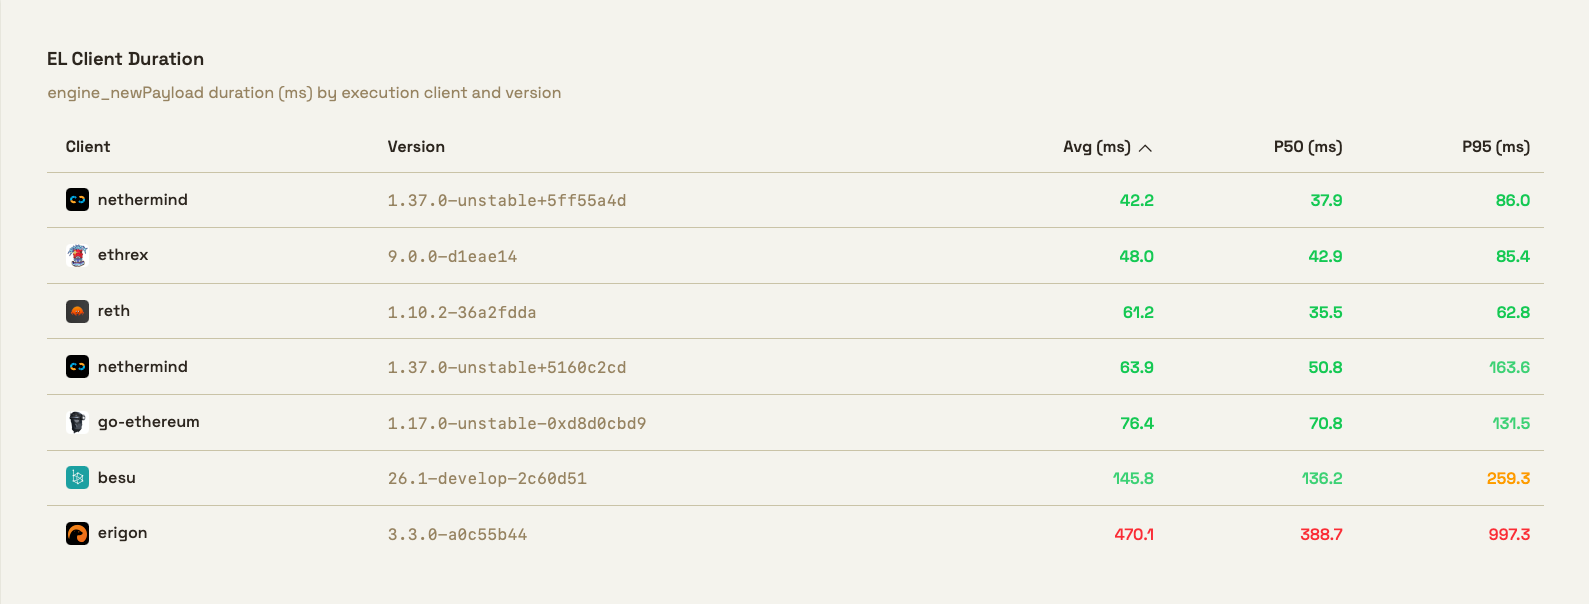
What you see there is a table comparing the latency in milliseconds of the engine_newPayload method, by execution client and version.
engine_newPayload is one of the core Engine API methods - it's the primary way the consensus layer tells the execution layer to validate and execute a new block.
In response, the execution client:
- Validates the payload structure
- Executes all transactions
- Verifies state root, receipts root, gas used, etc.
- Returns validation status
The three columns to the left list the average, and 50th and 95th percentile.
Here we want to point out another booby trap: as you may have heard, there are lies, damned lies, and statistics. Like we said, measuring is hard and how you measure matters.
What is the p50? Many software engineers equate it with the average. If you measure you API's endpoint latency, the p50 is what "the average user gets". But mathematically it's not exactly the same. In many circumstances, they are very similar, but the correct definition is that p50 is the median, the value where half the observations fall below it and half above.
All this assumes you are talking about the "raw" data, the base dataset.
When measuring live systems, or time series data, many implementations will sometimes use a sliding window of data. If you calculate a metric such as p50 over this processed data, you will get, or remove, artifacts. You can 'smooth out' your data, removing outliers or peaks.
So to reiterate, how you measure matters if you want to reason about a system's behavior. But when you want to compare against others, sometimes you need to compromise and measure in the same way.
Key optimization strategies
So what were the most important changes?
We can more or less group them by being related to:
- EVM execution
- general hashing
- data storage and its associated data structures, e.g. Merkle trees
- the architecture of the execution pipeline
Core EVM Optimizations:
EVM performance affects transaction execution speed directly, since this is 'interpretation overhead' of the virtual machine.
- New memory model (30% mstore improvement)
- Opcode lookup table (24% improvement)
- Inline common opcodes (30-40% for DUP/PUSH/SWAP)
- Stack pool reuse
- CALLDATACOPY/CODECOPY improvements (~20%)
Within the EVM, we identified two areas that could be improved: the main interpretation loop and the memory access patterns during contract code execution.
Gas benchmarks revealed significant performance bottlenecks in memory operations, particularly with the mstore instruction. We realized we needed to implemented a new memory model (#3564) with optimized access patterns and unsafe code optimizations where safe to do so.
With this change, benchmarks showed a 23% improvement on opcode based timings and 12% on end to end. After adding unsafe we see a 30% improvement on top of the mstore improvements and overall general improvements on other opcodes.
Stack object allocation consumed approximately 8% of execution time during transaction processing. We implemented (#5179) stack pool reuse across transactions within block execution. A single shared pool is created at the block level and reused throughout, using std::mem::swap() to exchange pools with VM instances.
Unnecessary heap allocations also occurred during execution of the very common CALLDATACOPY/CODECOPY/EXTCODECOPY EVM opcodes, so memory handling was optimized (#5810) in the copy operations. Overall this reduced block processing time in mainnet by 4-6ms.
The original implementation of the core loop of the VM used a match statement for opcode dispatch, which wasn't optimal for the hot execution path. Samply showed quite some time was spent on the execute_opcode function, so we replaced (#3669) match-based opcode dispatch with a function pointer lookup table for opcode resolution.
This netted a 24% improvement on MSTORE operations (beyond memory model gains) and included improvements across all gas benchmarks tested.
Overhead can come from deciding which opcode to execute, but also from calling into the code implementing said opcode. This function call overhead for frequently-executed opcodes was measurable in tight loops, so we inlined (#5761) the most commonly used opcodes (DUP, PUSH, SWAP, JUMP) directly into the execution loop, giving a 30-40% speed increase for those ops. This translated into a ~20% improvement in mainnet execution.
Hashing
When profiling and looking at the flamegraphs, we noticed that hashing functions appeared frequently. When hashes are used for coordination in a protocol or to uniquely identify data in shared databased, changing the hash function is delicate. However, when it is used internally the hashing function can often be switched to a faster one, especially if there is contextual information about the data being hashed (e.g. in compilers, hash functions specialized for short strings are very useful).
We replaced the default hash function with fxhash throughout the codebase: in the diff layers hash map (#5032), in the discv4 hash set of the peer table (#5688), and the access lists (#5824).
On the other hand, the SHA3/Keccak hash falls into the other category, it is a key cryptographic primitive that must at all costs be compatible with other implementations.
The pure Rust SHA3/Keccak implementation had room for optimization, and given the frequency of its use, we tried replacing it with a version written in assembly language. This was not hand-written in-house but sourced from the well-known CRYPTOGAMS, Andy Polyakov's project used to develop high speed cryptographic primitives.
Results were promising and the versions for x86 and ARMv8 were included, with fallback for unsupported platforms.
Storage & State Trie Optimizations
Optimizing the 'leaves' of the stack tree is often seen as the low-hanging fruit. It stands to reason that in general, if functions are called often, they will comprise a large portion of the execution time, and it will be worthwhile to improve them.
However, some improvements relate more to how data is moved around, and these changes require more "architectural" changes.
The Patricia Merkle Trie recalculated hashes for affected nodes on every modification causing "compulsive hashing" that was computationally expensive, so we refactored (#2687) it to defer hash computation until actually needed. Direct node hash references were replaced with either cached NodeHash values (unmodified nodes) or actual node objects (changed nodes), delaying hashing to commitment time.
This was one of the most impactful of the early optimizations, cutting trie insertion time nearly in half.
The first time we achieved a mainnet sync it worked, but was slow.
The database was using an immutable, hash-based approach which led it grow needlessly. The first change was to make it path-based, which improved it somewhat but more importantly led to the next change which was add a flat key-value layer on top to avoid traversing the tree to read values.
After improving the base data structures, we started looking for concurrency opportunities. Perhaps things could be done in background?
As it turns out, the apply_updates function executed synchronously during block production, creating blocking operations that delayed execution.
The post-execution trie updates were moved (#4989) to a background thread which receives messages through a channel to apply new trie updates and does two things: First, it updates the in-memory diff layers and notifies the process that sent the message (i.e. the block production thread) so it can continue with block execution. Second, it performs the logic of persisting the bottom-most diff layer to disk. To do this, we first pause the ongoing thread in charge of generating the snapshots (i.e. FlatKeyValue) through a message, then persist the diff layer to disk, then notify again the thread to continue snapshot generation.
This reduced block execution latency and improved block production throughput by enabling better overlap of I/O and computation.
Block execution and merkle tree updates were sequential operations, leaving CPU resources underutilized, so block processing was restructured (#5084) to overlap EVM execution and merkle tree updates, allowing both to proceed in parallel.
This pipelining of merkleization and execution gave a ~47% improvement on the ethrex-trie insert 1k benchmarks.
Searching for more opportunities to parallelize work, we saw that merkleization was single-threaded and not utilizing available CPU cores. Could merkleization itself be parallel?
We took a Gravity-like top-down sharding approach, implementing 16-way parallel merkleization by extending the previous pipeline to shard the updates and join the updated tries at the end (#5377). Each worker thread handles accounts whose hashed addresses begin with a specific nibble (0-F). Combined with pipelined VM execution and merkleization, this removes merkleization from the critical path.
Execution Pipeline:
One of our biggest wins came from a recent improvement to caching by adding speculative out-of-order execution to prewarm caches, AKA execution-based prewarming (#5906). While transactions must execute sequentially (each depends on the previous state), we can speculatively execute them in parallel to predict which accounts and storage slots will be read and cache these values ahead of time, Once the cache is warm, actual sequential execution proceeds, reducing I/O during actual execution.
This showed a clear (724->968 in MGas/sec, 1.64s->1.23s total latency) improvement when benchmarking artificially big (gigagas) blocks, and a ~10% improvement in the current mainnet.
The follow-up change #5999 added a shared cache between prewarm workers, inspired by reth's approach, so multiple workers don't fetch the same state multiple times. This sped up block execution throughput between 20 and 25%. On one of our servers we saw throughput go from 514 to 637 MGas/sec and latency go from 64 to 57ms (12% improvement).
This is one of the most impactful of the more recent optimizations, achieving significant gains through parallelization without changing execution semantics.
Going Forward
These optimizations represent months of profiling, benchmarking, and iterative improvement and collectively enable ethrex to process blocks faster, use less memory, and better utilize modern CPU features like SIMD and multi-core parallelism.
The work is far from done, and even more improvements are already in the works.
The journey from 20 MGas/sec to 400 MGas/sec demonstrates that there's always room for optimization when you profile systematically and address bottlenecks methodically.
All benchmarks were run on our performance testing infrastructure. Individual results may vary based on hardware and workload characteristics.
