Tekton: deploying AI Agents at scale for the next generation of software development
AI is now good enough to tackle most software but it is not yet perfect. The challenge is to leverage AI to increase our productivity without sacrificing quality or safety; keeping humans in the loop, increasing visibility, reducing friction and adding guardrails.

We have been following closely the advancements in AI at LambdaClass. In the past few months, the jump in quality for coding agents has been impressive, and this requires a fundamental rethinking of how software is developed. Developers increasingly lean into agents like Claude code, Codex or Kimi for their everyday work; what was once used for menial tasks like adding tests and reviewing code is now being used for entire features or even entire projects.
You can see examples of this on our own github. Rust libraries rewritten from scratch using AI, with impressive results; performance improvements for ethrex found constantly using Claude in automated setups; backtesting software rewritten in Rust, with new features on top, in a matter of days; a formally verified optimizing compiler written in Lean; 2D and 3D structural analysis tools running directly on the browser; the list goes on.
These projects range from traditional SaaS, to low level rust code, to compilers; AI is now good enough to tackle most software. However, this does not mean it has free rein over our projects and can do as it pleases. It is not yet perfect; it frequently makes mistakes and needs to be course corrected. The challenge is to leverage AI to increase our productivity without sacrificing quality or safety; this requires keeping humans in the loop, increasing visibility of our work, reducing friction and adding guardrails so AI can't overstep its boundaries.
Enter Tekton
To aid in all this, we started work on a self-hosted platform for running AI agents at scale, named Tekton. Inspired by Michael Stapelberg's post on running coding agents in NixOS, we set out to create the infrastructure to spin up lightweight, ephemeral VMs ourselves. This gives us:
- a simple, declarative way of dealing with dependencies, ensuring builds are reproducible and avoiding dependency hell via nix
- a guardrail to ensure agents can't do anything dangerous and can only access the environment they are given via VM isolation
With this, anyone can go from a new idea, to an agent working on it in an isolated environment, to it deployed on a VM in a matter of seconds. On top of this, we built a web dashboard for anyone in the organization to use and see what others are working on. This is not just meant for developers; product managers and other non-technical people from the team can use it to try out ideas and get better feedback on what everyone else is doing.
The screenshot below shows the "Tasks" tab on our dashboard. A list of different tasks from users is shown; each one is its own instance where users sent prompts and then iterated on a feature.
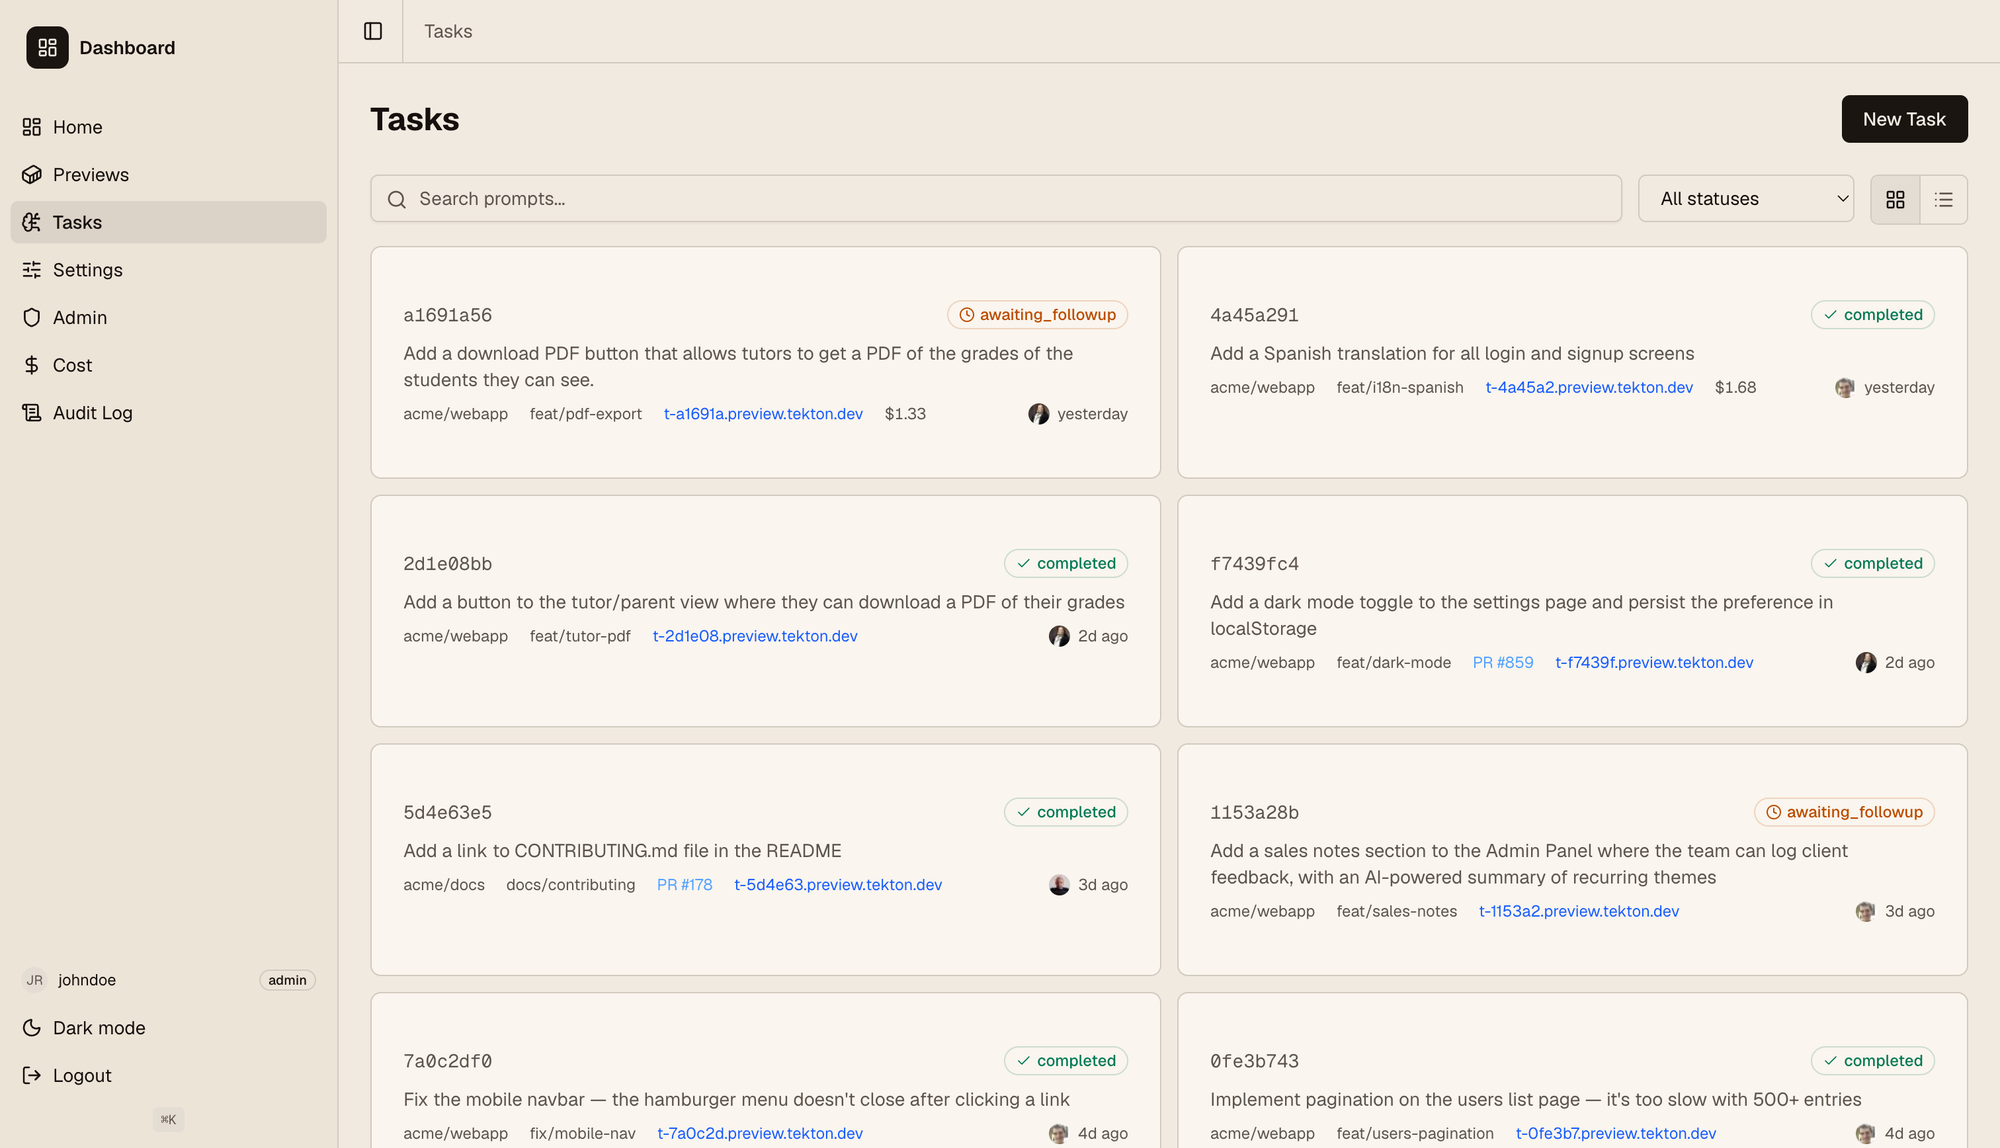
The links shown on each card points to a VM where it's deployed, so anyone can quickly read the prompt, then see it in action immediately. As can be seen on the left, the dashboard has an RBAC model with roles and permissions; users have different permissions and may only see specific repos, have read-only access (i.e. can see tasks but not interact with the agent), etc. We also track the agent cost for each user and show it for admins to make sure we don't go overboard. We use OpenRouter to support different models out of the box, and users can select it from their settings tab.
When clicking on a task you go to their detail page, seen below.
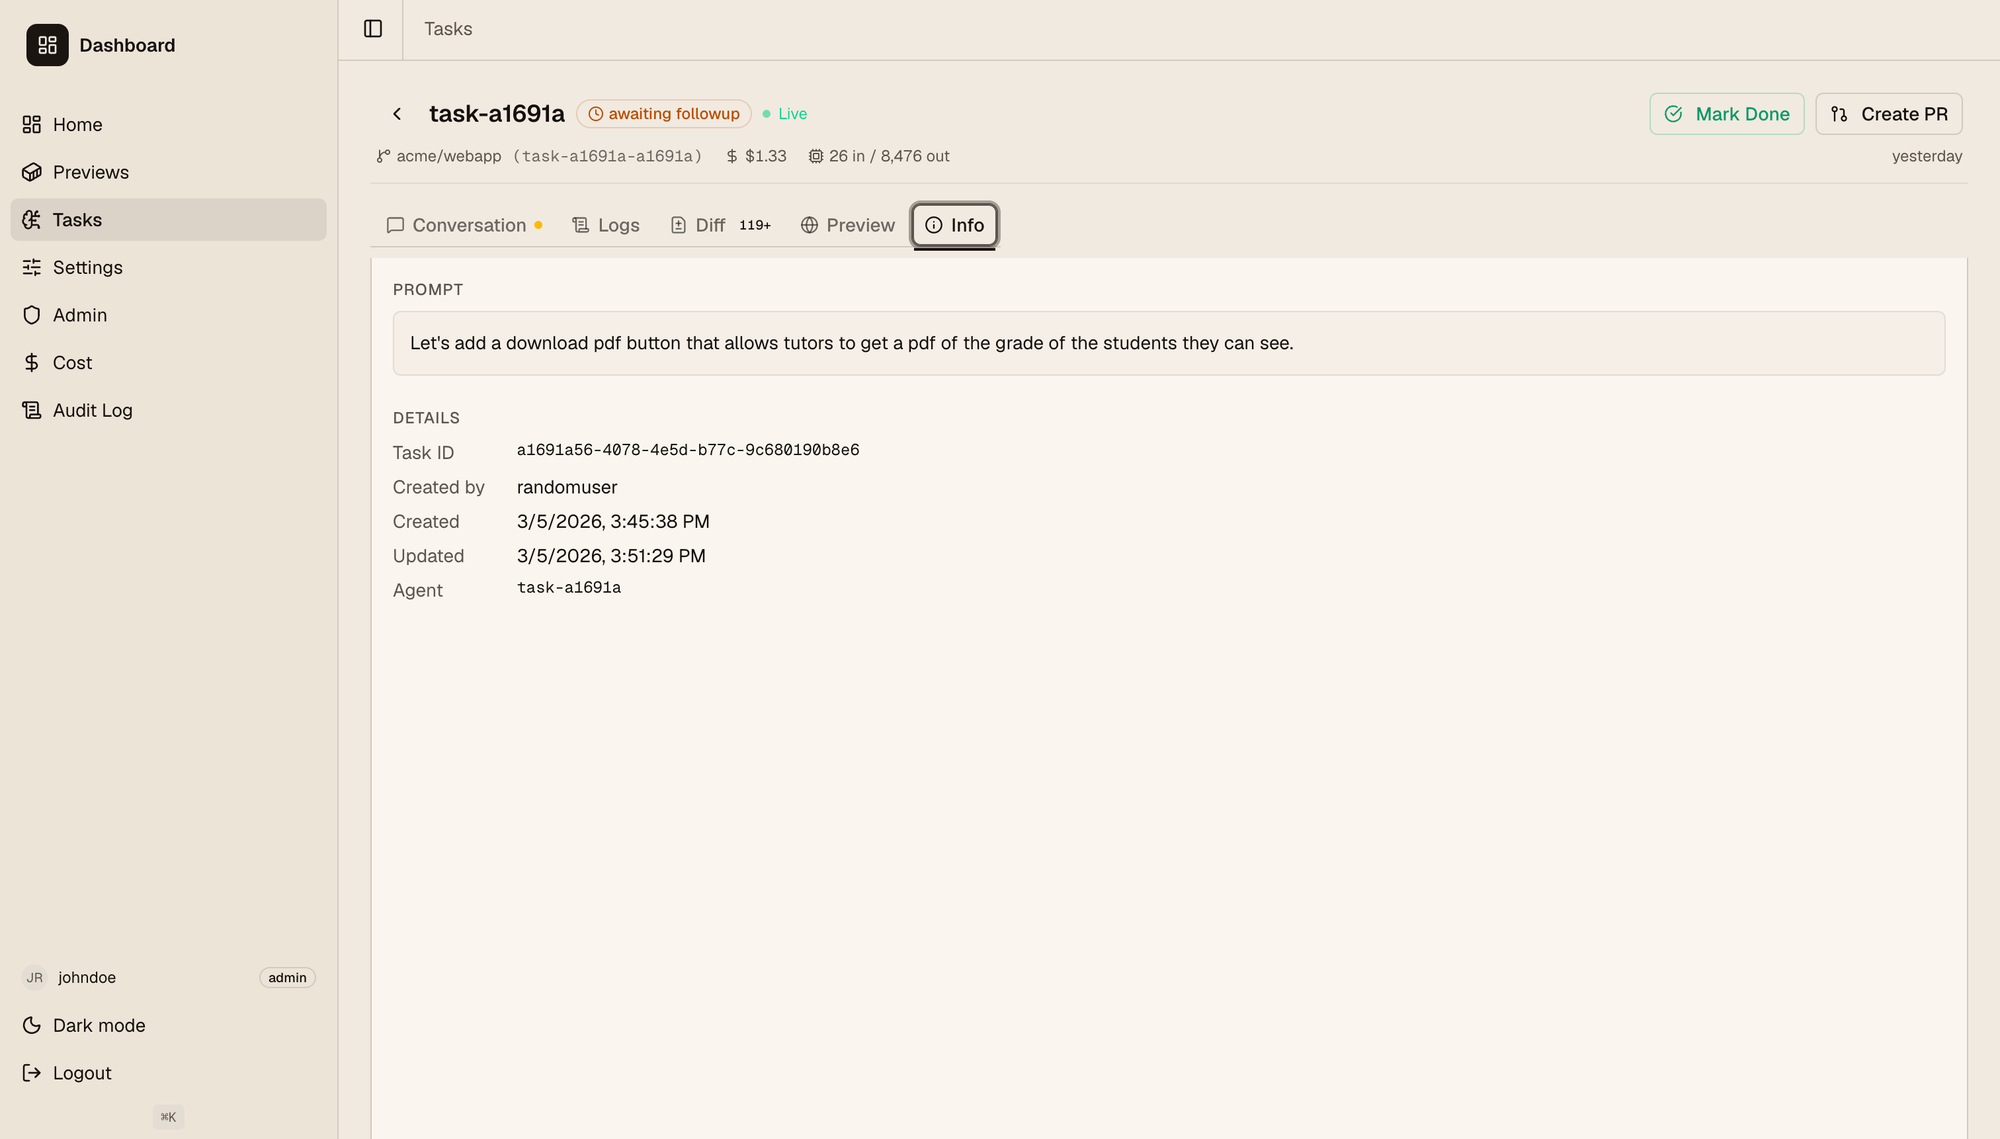
Here users can check:
- The full historical conversation with the agent. This is open so people with the right permissions can follow up on the conversation and keep asking the agent to change things out, explain the feature to them, etc.
- The full logs, both from the VM where the feature is deployed and the agent VM, where you can see the full agent logs (not just the conversation).
- The code diff generated on this branch for the given feature. Developers can go through it the same way as on github.
- The Preview tab has an embedded iframe with the deployed app if it's a web app, and a link to it if users want to visit it on a separate tab.
- The info tab shown on the screenshot.
When the feature is done, a PR can be created from the dashboard itself. We plan to support embedded reviews so the dashboard and github are in sync with each other, eliminating the back and forth between the two.
Technical deep dive
Tekton's architecture can be seen in the following diagram:
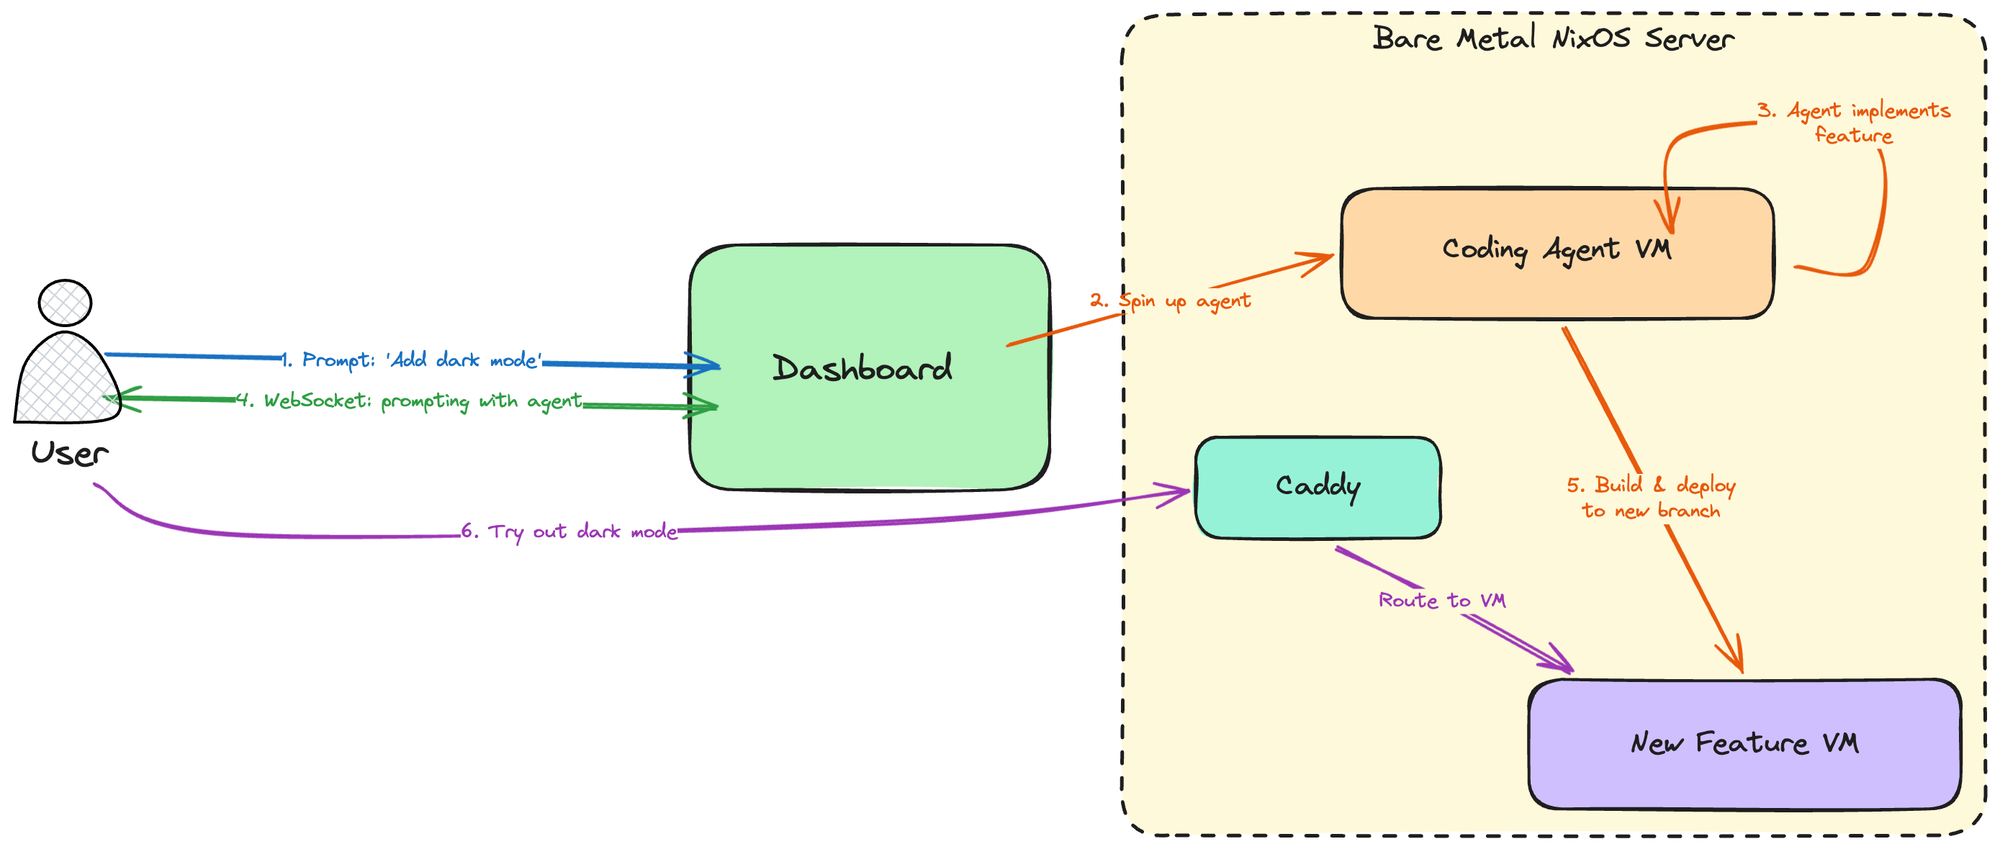
Our Bare metal server runs NixOS, and uses nspawn containers (we may switch to a nixos microvms setup in the future, but this is enough for our current usecase) to create lightweight VMs both for coding agents and for deploying anything users do. Users communicate with the dashboard, a React frontend with a Rust (Axum) backend which then manages the creation, destruction and communication with the VMs (both for coding and for deploying features).
When a user creates a new task (i.e. sends a prompt for a new feature they want to try out or build), the dashboard:
- Provisions a new VM and spawns an agent inside of it, which starts working.
- Opens a websocket with the user so they can see the agent's output and communicate with it for any back and forth that's needed.
- When the agent is done, it pushes the feature to a new branch, and a VM is deployed on it. A Caddy reverse proxy sits in the middle of the server and the VMs, a new subdomain is assigned to this new VM which Caddy maps accordingly, and the user can then visit their deployed branchon the browser and try it.
This example shows the flow for a typical SaaS web application. Other usecases differ, because "deploying" them might mean something completely different. For instance, if we were using this to try optimization opportunities for ethrex, once the agent is done we wouldn't want to deploy it on a VM, because performance needs to be measured in an appropriate environment on a dedicated server. In that case we may deploy it on said dedicated server instead and just point the user there. The core flow for Tekton remains the same though.
The one thing Tekton needs to know for each repo it integrates with is precisely what it means to deploy it. We do this through a simple .nix file that repositories need to expose, so Tekton can fetch it when deploying to build the repo accordingly, expose the appropriate ports, etc. You can check out a simple example of what this file might look like for python webserver here. The core part of it, aside from telling Tekton how to build the whole app, is this:
# Caddy routing: most-specific path wins; "/" must be last.
# Add stripPrefix = true to strip the matched prefix before forwarding.
routes = [
    { path = "/"; port = 8000; }
];
which tells us which ports we need to reach for our internal Caddy routing, to expose the app to the outside on a subdomain.
What's next
While this is already functional, it's still a work in progress. Because AI development is a new paradigm, we are still figuring out the right tools to leverage it appropriately and bring the best out of it. As such, it's very important that users' needs drive Tekton's development. Tekton is worthless if our team doesn't use it, so iterating on their feedback is currently the top priority.
We are, of course, not the only ones to work on a tool like this. We took ideas from Ramp, Stripe, OpenAI and many others. The landscape of AI software development is still mostly unexplored; experimenting with new ideas, discarding ones that don't work, and continuosly adapting are key to improve our productivity and stay on top.
Check out our repo for updates https://github.com/lambdaclass/tekton.
